
Estimated Flood Probability Map
Spatial visualization of the estimated flood probability for a forecast horizon of 0–72 hours, as calculated by the Dynamic Flood Hazard Assessment Model (DFHAM) and displayed through the Inachos system.
The initial view shows the maximum estimated indication per area within the selected 24-hour period. The hourly evolution is available as a second, more detailed view.
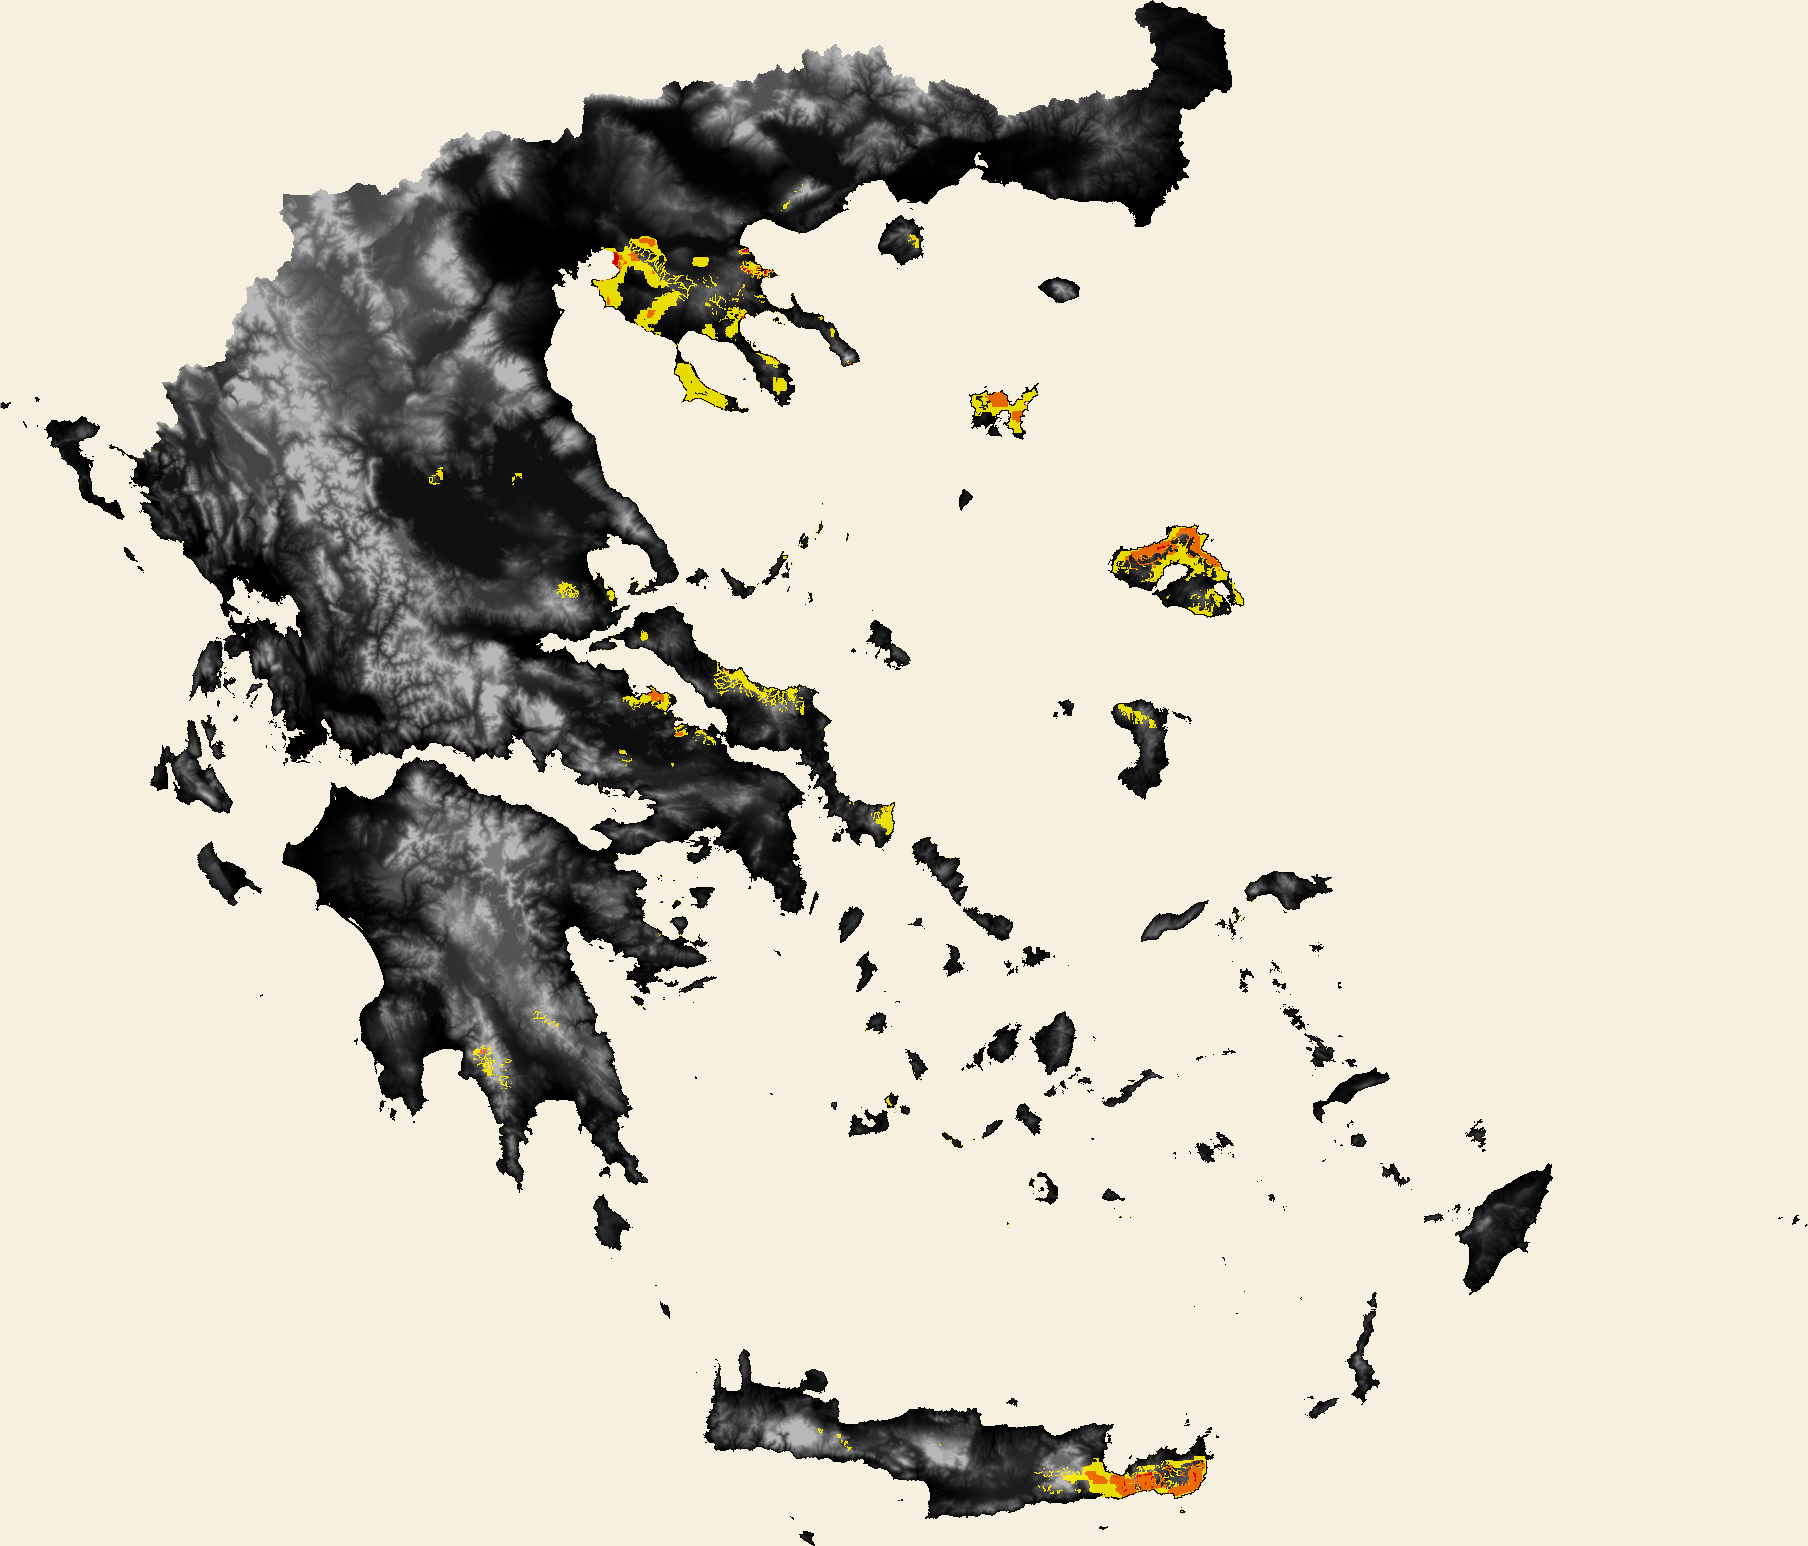
The colour classes show the maximum estimated flood probability calculated for each area within the selected 24-hour period.
This view is summary-based: each cell shows the maximum value that occurred within the corresponding 24-hour period.
Maximum values do not necessarily occur simultaneously across all areas.
The maps constitute a research/pilot estimate and do not replace official warnings or announcements issued by the competent authorities.